Understanding Status Indicators
Product Classifier uses color-coded status indicators throughout the interface to communicate classification outcomes at a glance. These visual cues help you quickly identify successful classifications, lower-confidence results, and issues that need attention.
Where Status Indicators Appear
Status indicators appear in two places across the Product Classifier interface:
Playground
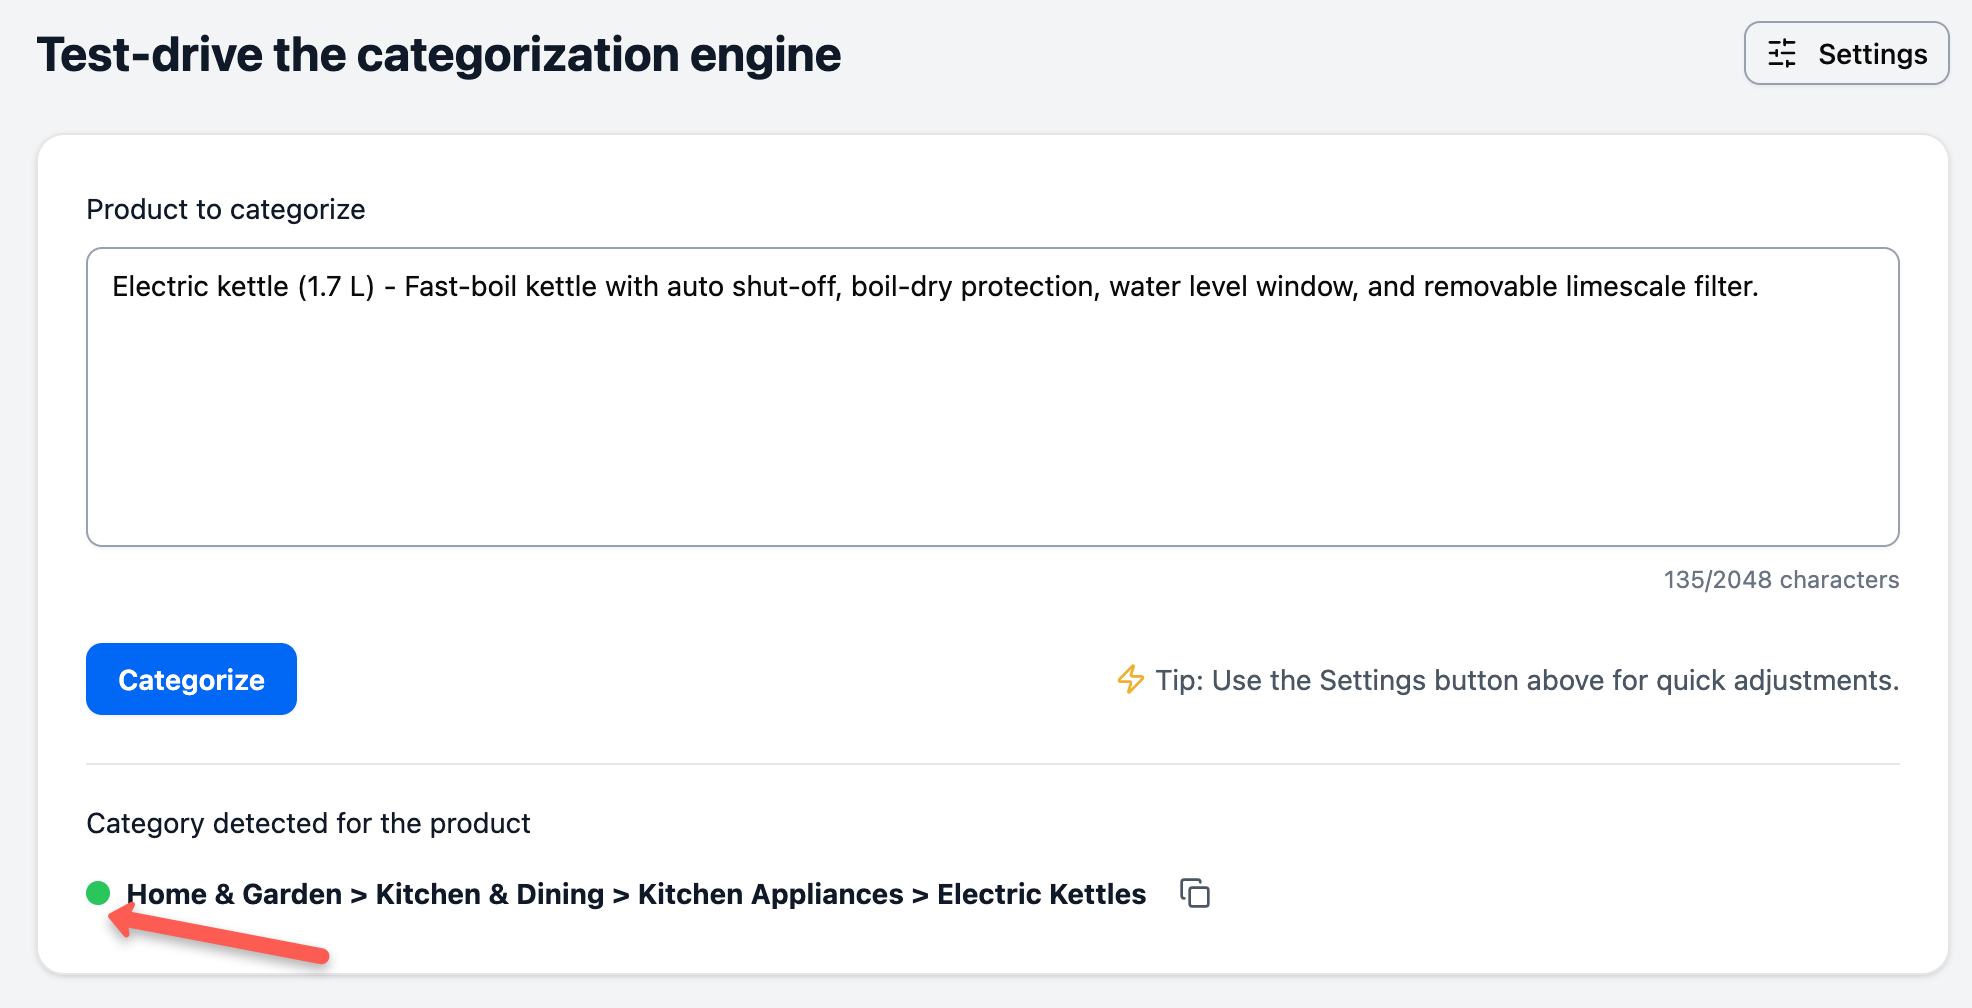
After running a classification in the Playground, a colored circle appears next to the returned category. This provides immediate visual feedback on the classification outcome.
History Page
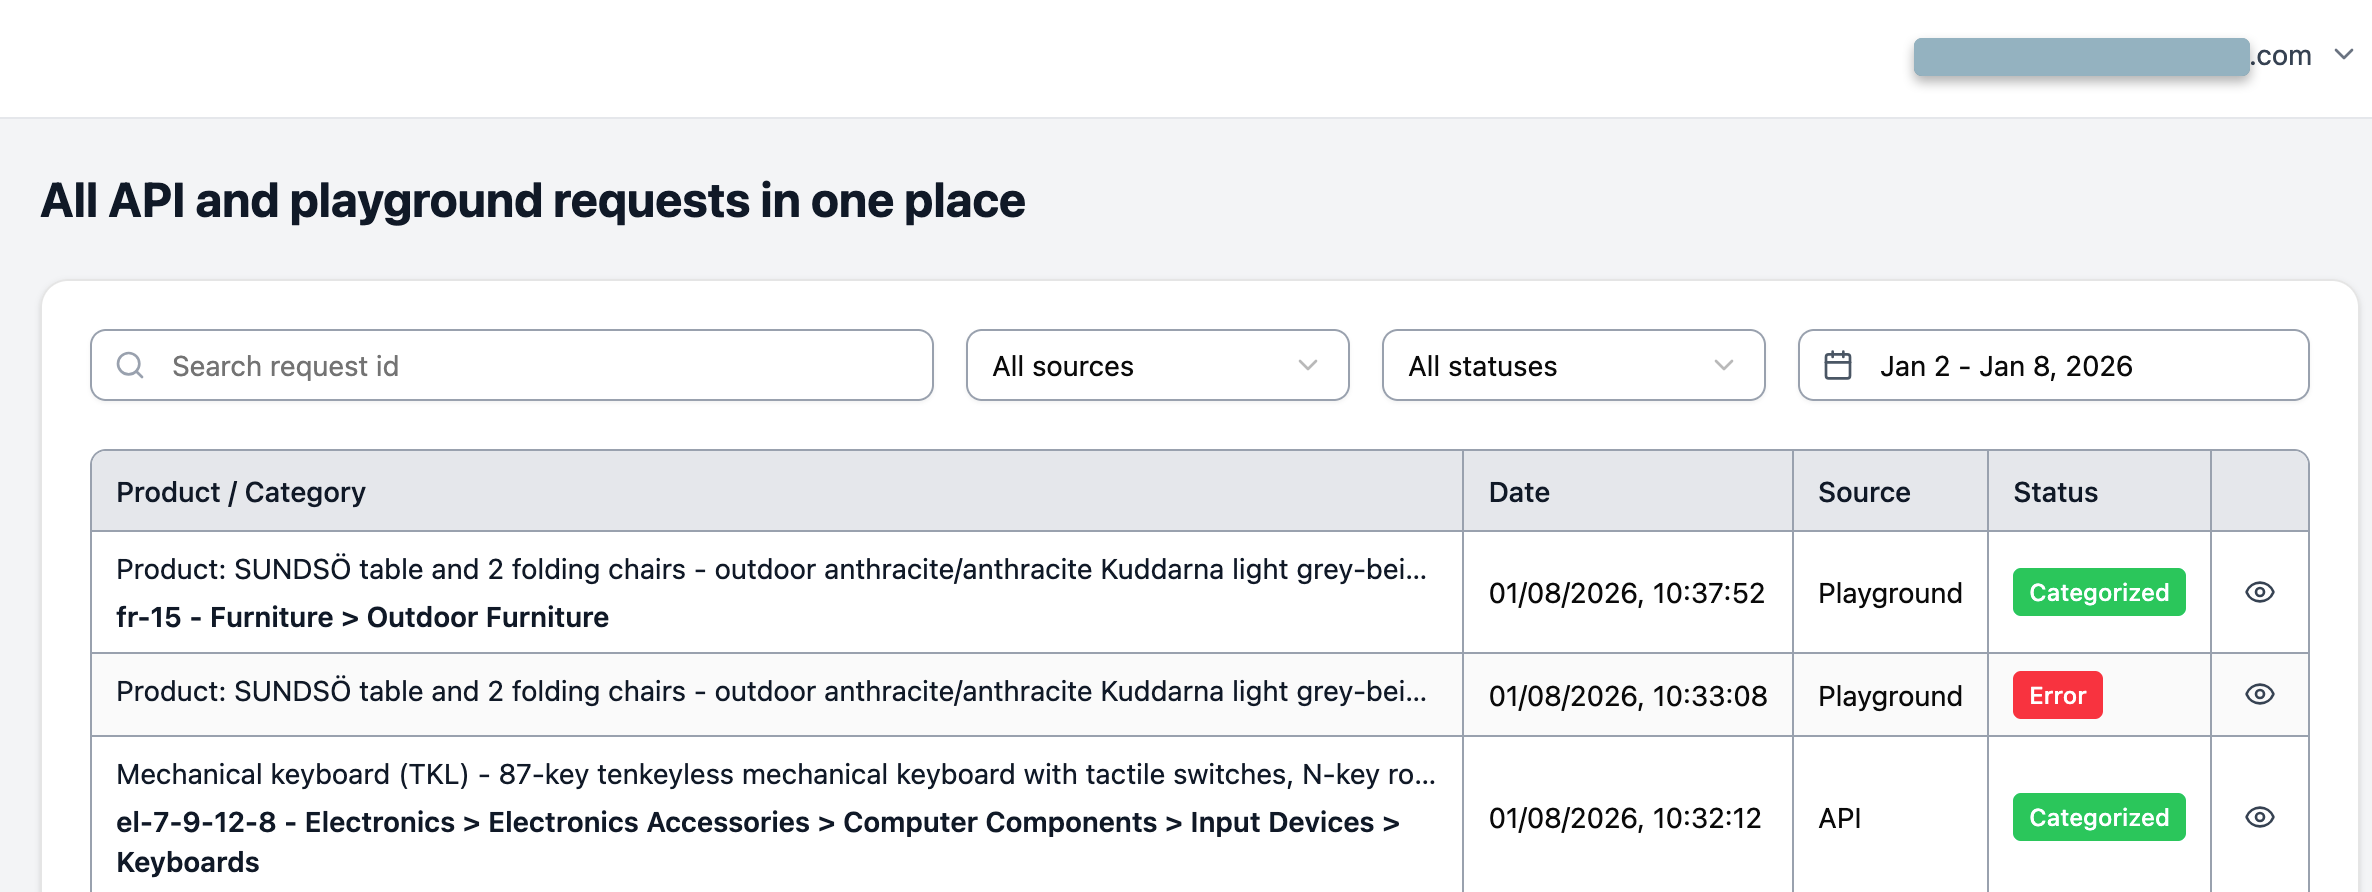
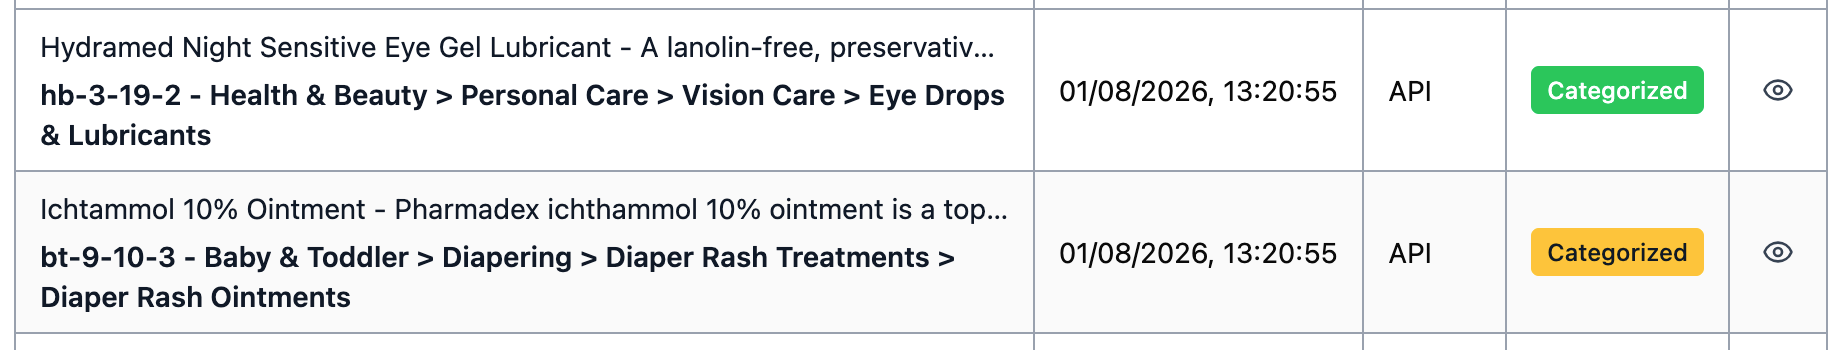
The History table includes a Status column with color-coded badges for every classification request. This lets you scan your classification history and identify patterns across multiple products.
The colors work identically in both interfaces, so once you understand what each color means, you can interpret results consistently throughout Product Classifier.
Understanding Each Status
🟢 Green: AI-Selected Category
What it means:
The AI confidently selected this category from the candidate set. This is the ideal outcome—the system analyzed your product description, evaluated potential categories, and determined this specific category is the best match.
Technical details:
- API response:
"confidenceLevel": "AI" - The AI actively chose this category during Step 2 of the classification pipeline
- No fallback mechanism was needed
- The category selection is based on semantic understanding, not just similarity scores
When you see this:
Green indicators represent your most reliable classifications. The AI evaluated the product description, taxonomy structure, and any custom instructions you provided, then made a confident determination.
What to do:
For products with green indicators:
- Verify the category matches your expectations - Even confident AI selections can occasionally miss nuances specific to your business
- Note the pattern - Products that get green indicators have descriptions the AI understands well
- Use as examples - When writing product descriptions for similar items, model them on products that get green indicators
Strategies for increasing green results:
If you’re getting fewer green indicators than desired:
Improve product descriptions - The AI needs sufficient context to make confident decisions. Add:
- Specific product features
- Material information
- Use cases or target audience
- Brand name and model number (when relevant)
Compare products that get green vs yellow/gray indicators to identify what information makes the difference.
Add custom instructions - If similar products consistently get yellow or gray indicators due to legitimate ambiguity, write custom instructions that provide disambiguation rules. See Writing Custom Instructions for detailed guidance.
Test incrementally - After improving descriptions or adding instructions, re-classify the same products to verify your changes increased green results.
What green trends mean:
Predominantly green results indicate your descriptions and configuration work well together. The AI has enough context to make confident decisions for most products.
Roughly equal green and yellow/gray results suggest optimization opportunities. Your descriptions may need more detail, or your settings may need adjustment based on your strategy.
Few green results signal a systematic issue. Review your description quality, consider whether products fit the taxonomy, and adjust your classification strategy.
🟡 Yellow: Top-Ranked Category
What it means:
The AI couldn’t confidently choose between multiple categories, so the system returned the candidate with the highest relevance score. This is a fallback mechanism that prioritizes coverage over precision.
Technical details:
- API response:
"confidenceLevel": "RelevantCategory" - The AI reached Step 3 of the classification pipeline (fallback behavior)
- Requires
fallbackToBestGuesssetting to be enabled - Based on semantic similarity scoring rather than AI selection
When you see this:
Yellow indicates ambiguity. The product description didn’t provide enough information for the AI to distinguish between similar categories, or multiple categories legitimately fit the product equally well.
What to do:
Yellow results require more attention than green results:
- Review the category - The top-ranked category may still be correct, but verify it matches your expectations
- Check if it’s a recurring pattern - If many similar products get yellow indicators, you need a systematic solution
- Prioritize for review - In bulk classifications, manually verify yellow results before finalizing
Strategies for reducing yellow results:
Yellow indicators signal improvement opportunities. Here’s how to turn them green:
Add distinguishing details to descriptions:
Yellow results often occur because sibling categories have similar scores and the description doesn’t provide distinguishing information.
Example:
Description: “iPhone 16 Pro smartphone” Result: 🟡 Yellow - Mobile Phones
The AI can’t determine if this is a contract phone, pre-paid phone, or unlocked phone because those details aren’t in the description.
Improved description:
“iPhone 16 Pro unlocked smartphone “Result: 🟢 Green - Unlocked Mobile Phones
Write custom instructions for recurring patterns:
If the same type of product consistently gets yellow indicators, add an instruction that resolves the ambiguity:
For phones without contract information, default to unlocked unless description explicitly states contract or pre-paid.
After adding this instruction, re-classify affected products. Many should turn from yellow to green.
Adjust settings based on your strategy:
If yellow results persist and you prefer no result over a guess:
- Disable
fallbackToBestGuess - This converts yellow results to gray (no category found)
- Then you can focus on improving descriptions for products with no category
See Classification Strategies for detailed guidance on configuration approaches.
Accept strategic yellow results:
Not all yellow indicators need fixing. In some situations, yellow results are acceptable:
- Initial catalog imports where you’ll review results manually
- High-volume operations where some imprecision is tolerable
- Products with inherent ambiguity that even humans struggle to categorize
Focus your optimization efforts on high-value products or recurring patterns rather than trying to eliminate every yellow indicator.
What yellow trends mean:
Few yellow results indicate strong description quality or that ambiguity is rare in your catalog. The AI can make confident decisions for most products.
Many yellow results signal that products lack distinguishing details or fall into genuinely ambiguous zones. This is expected with Maximum Coverage and Specific Categories Required strategies, but suggests improvement opportunities with Precision First.
Increasing yellow trends over time may indicate new product types with insufficient descriptions, or that recent inventory changes introduced more ambiguity.
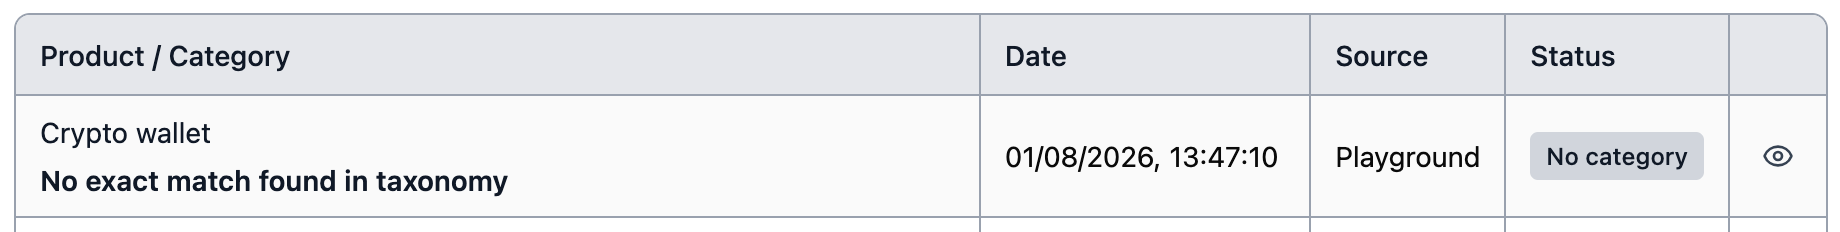
⚫ Gray: No Category Found
What it means:
The AI cannot confidently select a category, and no fallback mechanism is available. The system returns no category rather than guessing.
Technical details:
- API response:
"confidenceLevel": "None"and"categoryFound": false - The AI reached Step 3 but
fallbackToBestGuessis disabled - All category fields return
nullor empty values
When you see this:
Gray indicates the AI lacks sufficient information to make any determination, or the product doesn’t fit the taxonomy well. This is the most conservative outcome—no guess is made.
What to do:
Gray results require action before products can be properly categorized:
- Examine the product description - Is there enough context for classification?
- Check if the product fits the taxonomy - Some products may be outside the taxonomy’s scope
- Determine if manual classification is needed - Some products may require human judgment
Strategies for reducing gray results:
Gray indicators point to fundamental issues with either the description or taxonomy fit:
Enhance product descriptions significantly:
Gray results typically indicate the description is too vague or missing critical information.
Example:
Description: “Blue item” Result: ⚫ Gray - No category found
This description provides almost no classification information.
Improved description:
“Blue ceramic coffee mug with 12oz capacity, microwave safe” Result: 🟢 Green - Mugs
Add comprehensive details:
- What the product is (not just color or size)
- Primary materials
- Key features or functions
- Brand/model (when relevant)
Verify taxonomy fit:
Some products may not fit well in standard taxonomies. Consider:
- Highly specialized products - May be too niche for general taxonomies
- Multi-purpose products - May legitimately span multiple categories
- New product types - Emerging categories may not exist in the taxonomy yet
For products that don’t fit, either:
- Classify them manually into the closest reasonable category
- Contact support about taxonomy coverage gaps
- Use a different taxonomy (Shopify vs Google) that may have better coverage
Enable fallback for initial coverage:
If you’re getting many gray results:
- Enable
fallbackToBestGuessto convert gray to yellow - Review the yellow results to see what categories are suggested
- Improve descriptions based on which categories the system is considering
- Re-classify with fallback disabled to see if they now get green indicators
This diagnostic approach helps you understand what information the AI needs.
Write targeted custom instructions:
If certain product types consistently return gray:
For power tools without specific type information, classify as general power tools rather than returning no category.
Plan for manual classification:
Accept that some products need manual handling:
- Products that legitimately don’t fit the taxonomy
- Highly ambiguous items that even humans struggle with
- Products with inherently insufficient information
Track which product types consistently get gray indicators and consider systematic manual classification for those categories.
What gray trends mean:
Few gray results indicate most products have sufficient information for classification. This is expected with Maximum Coverage strategy (which converts potential gray to yellow) but less common with Precision First.
Many gray results signal that descriptions are too vague or products don’t fit the taxonomy well. This is the expected outcome with Precision First strategy when the AI lacks confidence—you’ll need to improve descriptions or classify manually.
Increasing gray trends over time suggest declining description quality for new products, or that recent inventory includes items outside the taxonomy’s scope.
🔴 Red: Error Occurred
What it means:
An error prevented the classification request from being processed. This is not a classification outcome—it’s a technical failure.
When you see this:
Red indicators signal technical problems that need immediate attention. Unlike other statuses, red doesn’t represent a classification outcome—it means the request failed before classification could occur.
What to do:
Red results require troubleshooting the technical issue:
- Click View to see error details - The error message indicates what went wrong
- Check the error type - Different errors require different solutions
- Resolve the underlying issue - See Error Handling and Response Codes for detailed troubleshooting
Red indicators should be rare in normal operation. If you see many red results, there’s a systemic issue with your integration or account status.

Status Patterns and Analysis
Healthy Distribution
For most production use cases, a healthy status distribution looks like:
- 70-85% green - Majority of products are confidently classified
- 10-20% yellow - Some ambiguity that’s acceptable
- 0-10% gray - Few products need manual handling
- Under 1% red - Minimal technical errors
Understanding Status Distribution by Strategy
Different classification strategies produce different status patterns. What’s “healthy” depends on your chosen approach:
[Screenshot: History page showing a healthy mix of predominantly green results, with some yellow and very few gray results]
Maximum Coverage Strategy:
- Expect: Predominantly green and yellow, minimal gray, rare red
- Yellow is acceptable and expected—the fallback mechanism provides coverage
- Few or no gray results since fallback converts them to yellow
- Focus: Verify yellow results are reasonable, even if confidence is lower
Precision First Strategy:
- Expect: Mix of green and gray, no yellow, rare red
- Yellow results don’t occur (fallback disabled)
- Gray results are expected—the AI refuses to guess
- Focus: Improve descriptions for gray results or accept manual classification
Specific Categories Required Strategy:
- Expect: Mix of green and yellow (all leaves), minimal gray, rare red
- More yellow than Maximum Coverage due to leaf-only constraint
- Yellow leaf results meet platform requirements even with lower confidence
- Focus: Use custom instructions to reduce yellow, verify leaf specificity is correct
Concerning Patterns
Watch for these patterns that indicate issues:
Predominantly yellow results with Maximum Coverage or Specific Categories Required:
- Product descriptions lack distinguishing details
- Too many ambiguous products for your taxonomy
- Custom instructions needed for recurring edge cases
Action: Review descriptions for yellow products, add custom instructions for patterns, or adjust your classification strategy.
Predominantly gray results with Precision First:
- Product descriptions are too vague
- Products don’t fit the taxonomy well
- AI can’t make confident decisions based on available information
Action: Significantly improve description quality or consider switching to Maximum Coverage strategy if you need higher coverage.
Testing and Iteration Workflow
Use status indicators to guide your optimization process:
Initial Assessment
- Classify a representative sample of your catalog
- Review status distribution - What’s the balance of green, yellow, gray, and red results?
- Identify patterns - Which product types get which statuses? Do similar products return consistent results?
Focused Improvement
Address status issues in order of priority:
1. Fix red results first
Red indicators represent technical errors that prevent classification:
- Review error messages in request details
- Check if errors affect specific product types or are widespread
- Contact support if errors persist with error details and Request IDs
2. Address gray results next
Gray indicators show products that need fundamental improvement:
- Examine descriptions for gray results - what information is missing?
- Look for patterns - do certain product categories consistently return gray?
- Decide whether to improve descriptions or accept manual classification
For Precision First strategy: Gray results are expected when confidence is low. Prioritize high-value products for description improvement.
For Maximum Coverage strategy: Gray results are rare. If you’re seeing them, enable fallbackToBestGuess or significantly enhance descriptions.
3. Optimize yellow results last
Yellow indicators represent opportunities for refinement:
- Compare yellow vs green results for similar products - what makes the difference?
- Identify recurring patterns that need custom instructions
- Determine if yellow results are acceptable for your use case
For Maximum Coverage strategy: Some yellow results are expected and acceptable. Focus on high-value products or recurring patterns.
For Specific Categories Required strategy: Yellow results are common due to leaf-only constraints. Use custom instructions to provide disambiguation for frequent cases.
Validation
After making improvements, verify your changes worked:
- Re-classify improved products - Run the same products through classification again
- Compare status changes - Did yellow turn to green? Did gray turn to yellow or green?
- Verify categories are correct - Improved statuses don’t guarantee correct categories - spot-check results
- Check for unintended effects - Did your changes negatively impact other product types?
Iteration Strategies
Different approaches work for different situations:
Iterative description improvement:
- Start with products that get gray indicators
- Add one type of information (e.g., material details)
- Re-classify and check if status improved
- If still gray/yellow, add another type of information (e.g., use case)
- Continue until you achieve green indicators or determine manual classification is needed
Custom instruction testing:
- Identify a recurring pattern in yellow/gray results
- Write a focused custom instruction for that pattern
- Re-classify affected products
- Verify the instruction improved results without breaking others
- Refine the instruction if needed
Strategy adjustment:
If your current strategy produces concerning patterns:
- Too many yellow with Maximum Coverage? Consider Precision First to focus on high-confidence results
- Too many gray with Precision First? Consider Maximum Coverage to increase coverage
- Need leaf categories but getting too many yellow? Invest in custom instructions for common ambiguities
Ongoing Monitoring
After initial optimization, maintain classification quality:
Track trends over time:
- Monitor status distribution as you add new products
- Note when new product types cause status changes
- Identify seasonal or inventory patterns
Spot-check regularly:
- Review a sample of recent classifications periodically
- Verify categories still match expectations
- Check that custom instructions remain relevant
Adjust as needed:
- Refine descriptions when new product types appear
- Update custom instructions as your catalog evolves
- Re-evaluate your strategy if business requirements change
React to concerning changes:
- Increasing yellow trends: New products need better descriptions or custom instructions
- Increasing gray trends: Description quality declining or new products outside taxonomy scope
- Sudden red results: Technical issue that needs immediate attention
Measuring Progress
As you iterate, track improvement indicators:
Directional improvement:
- Status distribution shifting toward more green over time
- Fewer gray results for similar product types
- Yellow results decreasing after custom instructions added
Classification consistency:
- Similar products returning similar categories
- Consistent results when re-classifying the same product
- Predictable outcomes for new products in existing categories
Business outcomes:
- Fewer manual classifications needed
- Products successfully published to target platforms
- Reduced time spent on category assignment
The goal isn’t perfection—it’s continuous improvement toward classification that meets your business needs.
Next Steps
Now that you understand status indicators:
- Viewing Request Details - Click View on any History entry to see complete classification information
- Filtering & Searching Requests - Use status filters to find all yellow, gray, or error results
- Writing Custom Instructions - Reduce yellow indicators with disambiguation rules
- Classification Pipeline and Settings - Understand how settings affect which statuses appear
- Using the Playground - Test description improvements and see status changes in real-time
- Classification Strategies - Choose the right approach for your status distribution goals